
NuSTAR Calibration Update - October 2021
A major update in the effective area calibration of the NuSTAR telescopes was released on October 26th, 2021 based on detailed analysis of more than nine years of observations of the Crab utilizing both focused and stray light measurements. Details of the analysis are presented in Madsen et al. (2021) and we provide here a summary of the significant changes in the calibrated performance of the NuSTAR telescopes.
The overall changes between the previous (CALDB 20211004 and earlier) and this calibration update (CALDB 20211020) are primarily off-axis dependent. Users of the updated calibration may see the following changes compared to previous analysis:- • A flux increase of ~5% for sources < 1' off-axis
- □ A flux increase of ~10% for sources 1' to 2' off-axis
- □ A flux increase of ~15% for sources > 4' off-axis
- • Slopes of power law model components may change by ~0.04 depending on off-axis angle
- • More accurate high-energy and high off-axis angle corrections
- • A better agreement in the FPMA and FPMB flux measurements
We expect that for most NuSTAR observations this calibration update will have little or no practical change, especially for analysis of low signal-to-noise spectra.
Case studies investigating the changes from applying the new CALDB to a sample of observations spanning a range of brightness and source types are presented in Madsen et al. (2021). Although the flux change is evident in the results using the new calibration, the small changes seen in the fitted parameters did not result in a new interpretation of the observations.
Background
The fundamental challenge in calibrating the NuSTAR optics resides in the complexities of the multilayer response of ~3000 mirror segments and so the calibration of the observatory effective areas relies on measurements of a standard candle astrophysical source. Due to initial uncertainty in the performance of the new multi-layer optics, the effective area calibration was intentionally adjusted to result in flux measurements in the middle of the spread of measurements of the same sources from coordinated observing campaigns on 3C 273 and PKS 2155-304 in 2012 by the Chandra, Suzaku, XMM-Newton, and Gehrels-Swift observatories (Madsen et al. 2015)
Updates to NuSTAR calibration in 2016 and 2020 included improvements to the gain correction, detector absorption parameters, relative FPMA/FPMB astrometry, and a temperature-dependent correction to the FPMA optics performance due to a tear in the thermal insulation on that optics module.
However, residual calibration features remained which are now corrected in CALDB 20211020. These include:
| Residual feature in previous calibration | Instrument response component |
| Differences in FPMA and FPMB spectra at low energies | detector absorption & vignetting function |
| Large spectral differences in measurements on different detectors in the same FPM | |
| Low energy residual "tails" in modeled spectra | detector response |
| Absorption line-like features in spectra | vignetting function |
Methodology
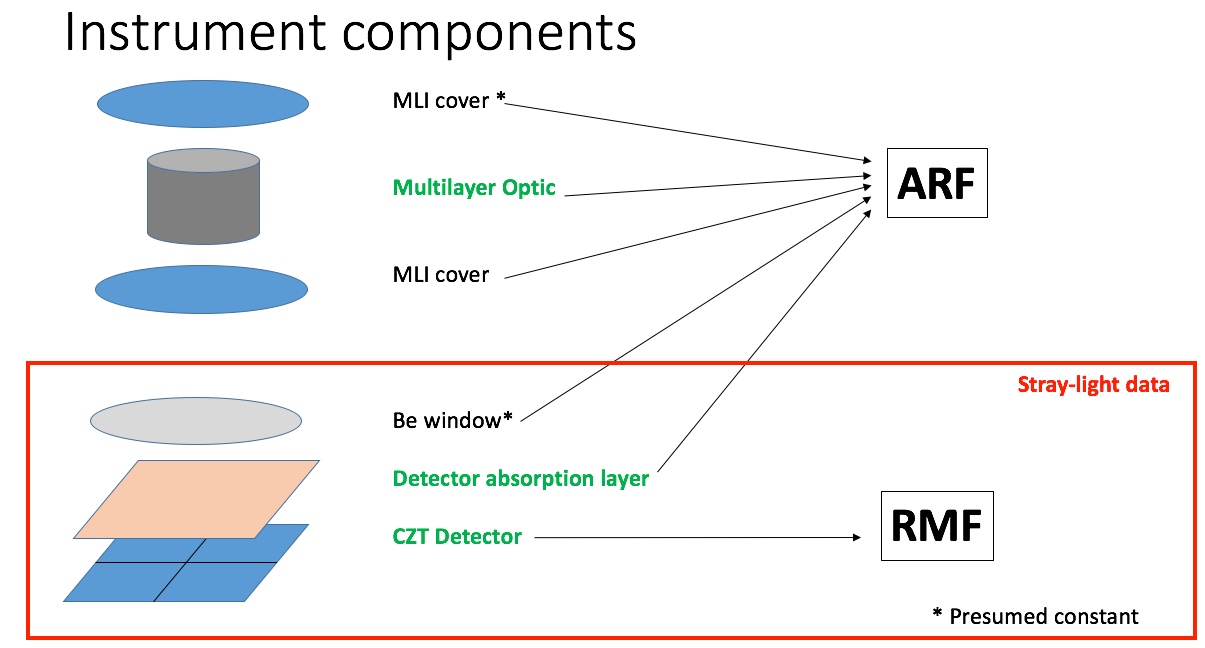 Previous calibration generation mixed the effect of detector absorption (DETABS) and detector efficiency (RMF) with the vignetting function to collectively account for inaccuracies across all sub-components of the telescopes. After ten years of operations we now have sufficient data to individually correct and remove the degeneracy of the effects from the vignetting function.
Since 2015 more than 500 ks of NuSTAR stray light observations of the Crab, by-passing the optics modules to directly illuminate the detector modules, have been used to re-measure and correct detector absorption coefficients and address the detector response below 5 keV.
This was followed by a re-calibration of the telescopes effective area using over 250 ks of focused Crab observations, comparing the measured spectrum to a model of the Crab spectrum.
This is represented by a power law with Galactic absorption:
| Canonical Crab spectrum (3-79 keV) model parameters | |||
| XSPEC model | tbabs x powerlaw | ||
| Previous | NH = 2.2 x 1021 cm-2 | Γ = 2.1 | N = 8.5 kev-1 cm-2 s-1 at 1 keV |
| Updated | NH = 2.2 x 1021 cm-2 | Γ = 2.103 | N = 9.69 kev-1 cm-2 s-1 at 1 keV |
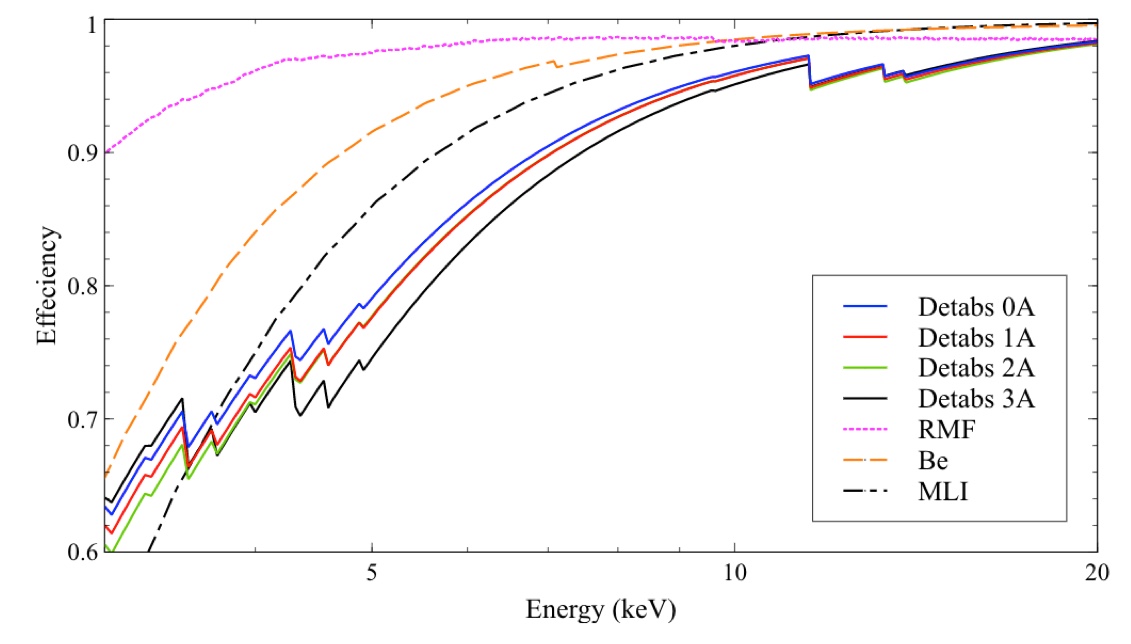 The figure on the left illustrates the low-energy absorption components for FPMA determined from analysis of more than 500 ks of stray light observations of the Crab. The stray light spectra are extracted for individual detectors to recover the distinct DETABS parameters for each detector, which are independent of observation epoch, and the residuals then provide the RMF correction. The use of the stray light data, which by-passes the optics, now removes the degeneracy with the effects of the vignetting function.
NOTE: The new RMFs have been calibrated down to 2.2 keV to ensure that data at 3 keV is resistant to redistribution errors from lower energy, but data should still only be fitted above 3.0 keV.
Effective area calibration
The NuSTAR Crab calibration campaign is on-going and provides measurements of the Crab spectrum at various off-axis angles and has provided 71 individual observations amounting to a total exposure time of 233 ks.
The measured motion of the NuSTAR observatory during each observation allowed a sub-division into exposure bins at various off-axis angles resulting in more than 106 counts per 10" wide off-axis bins from 0" to 420".
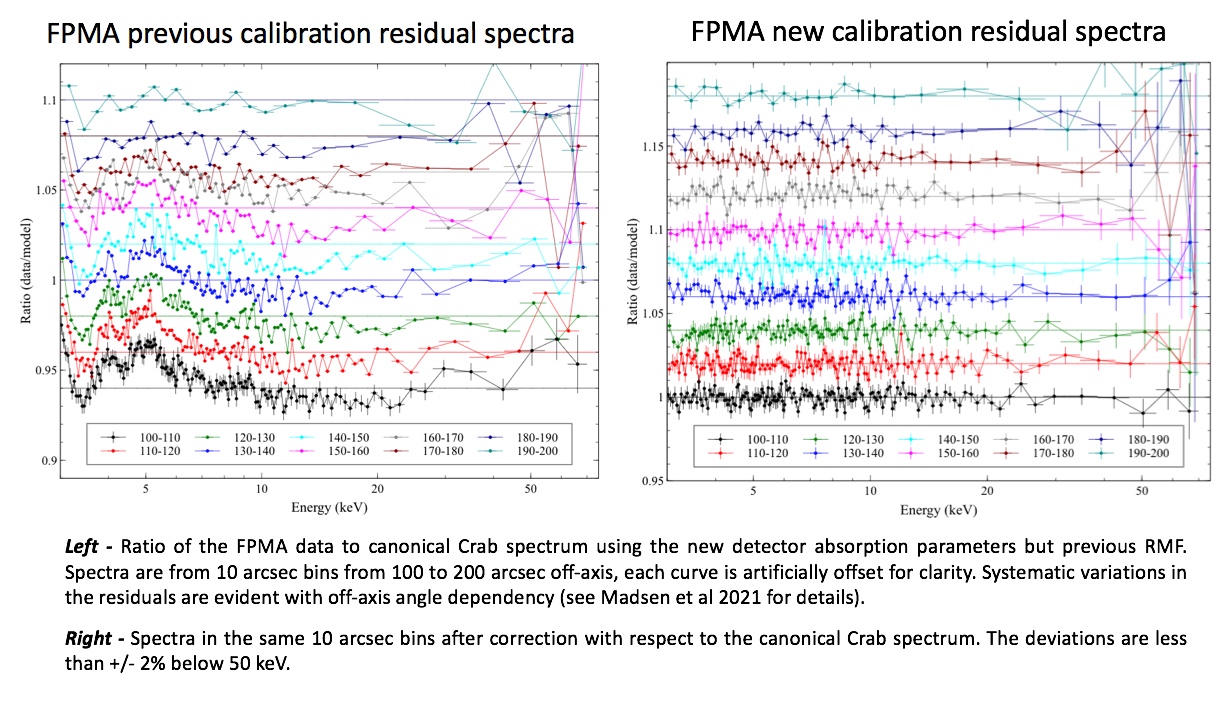
An iterative fitting procedure was devised to ensure good results, treating each off-axis bin with sufficient fidelity, to produce the correction to the response function as a function of energy and off-axis angle. The residuals compared to the canonical Crab spectrum using previous calibration and the new calibration are shown in the figures above. This visualizes how the previous responses had a dependency on off-axis angle in both slope and normalization, which are strongly coupled, and has been largely mitigated by the new responses.
The overall changes in analysis between the previous and new CALDB will depend on the off-axis angle of the target. A detailed investigation of the performance of the new calibration compared to previous calibration using all the focused Crab observations shows that for both modules the spread in slope and normalization has been significantly reduced using the new responses.
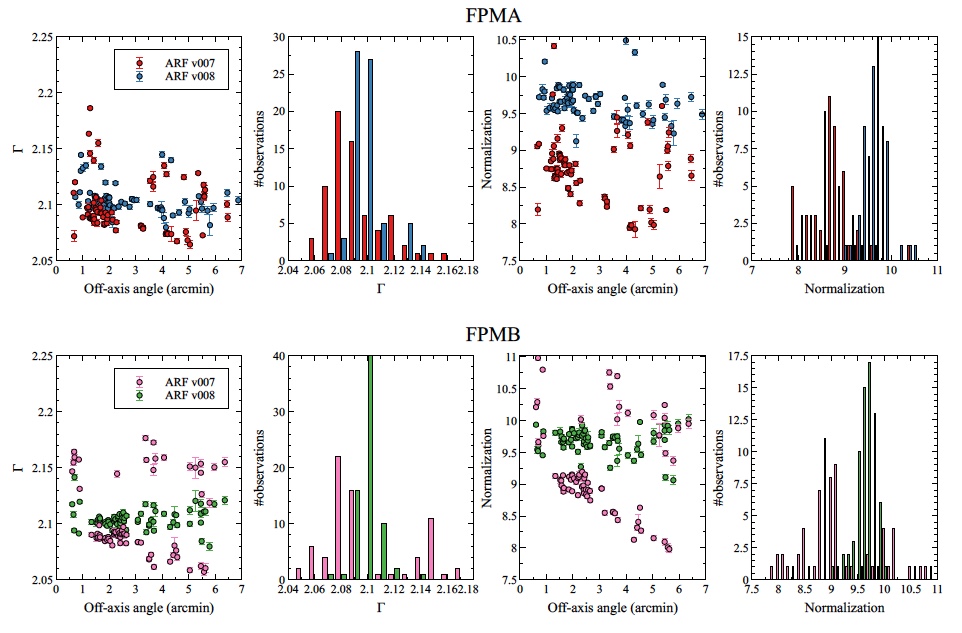
The figures above show the fitting results from all focused Crab observations reduced with the previous (ARF v007) and new calibration (ARF v008). For the power law slope the spread in values is significantly improved above 3' off-axis angle. Scatter still persists below 1', which is due to the Crab falling into the detector gaps, resulting in a change of the spectral parameters.
For the normalization, we observe a clear trend as a function of off-axis angle for the previous responses, which has been corrected in the new responses. The resulting flux increase that will be seen in reprocessed observations is therefore a function of the off-axis angle of the observation.
The improvement in the stability of the new calibration is evident in the smaller spread in the histograms of slope and normalization presented above and in the statistical average values of the Crab spectral analysis given in the table below.
Estimation of NuSTAR calibration accuracy
There remains a question about how much of the residual structure in analysis of the NuSTAR Crab observations is due to calibration and how much may be due to intrinsic variations of the Crab.
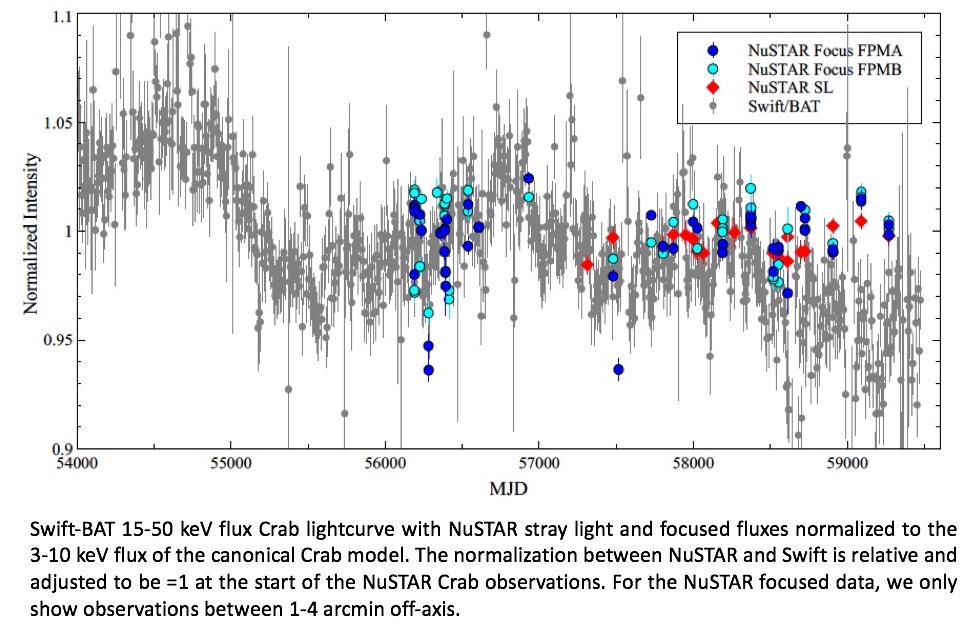 To address this the lightcurve of calculated NuSTAR fluxes of the Crab in both the focused and stray light observations was compared to the Swift-BAT 15-50 keV lightcurve. The NuSTAR flux has been normalized to the canonical 3-10 keV flux and the Swift-BAT data adjusted to be ~1 at the beginning of the NuSTAR observations.
The long-term Swift-BAT lightcurve of the Crab shows a slow variation of the Crab flux that can be 1-2% per year. The NuSTAR fluxes have remained stable over the same period, however the NuSTAR data does not show the flux decrease measured by Swift-BAT over the last few years (MJD 58800 = November 2019). The reason for this is yet unclear.
The re-calibrated NuSTAR responses have no time dependency.
The only two time dependent components in NuSTARDAS and NuSTAR CALDB are the evolution of the detector gain (which is linear, see Grefenstette et al. 2021) and the MLI correction (Madsen et al. 2020). Neither of these components have been calibrated with relation to the Crab so should not impact the measured variation of the Crab flux.
So, assuming that the remaining variations are not driven by intrinsic Crab variations, we take the fluxes and model power law slopes across the epochs of NuSTAR Crab observations to be a measure of the systematic error in NuSTAR calibration.
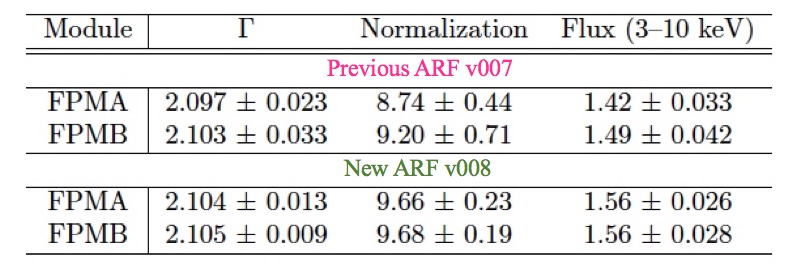 The table on the right summarizes the mean and standard deviation of the Crab model parameters for all NuSTAR focused observations between off-axis angles 1' to 4' with both the previous and new responses.
The conservative recommendation is to include systematic errors in power law slope of ± 0.01 and in flux of ± 3% when comparing multiple epochs.
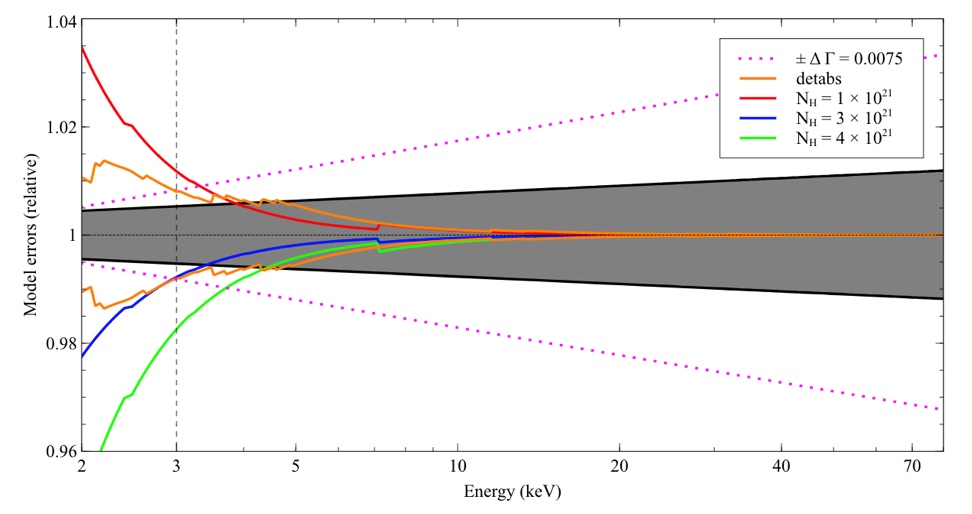
These systematic errors should be taken in conjunction with the possible errors on the Crab model components shown in the figure on the left.
This shows the relative effect of the possible uncertainty in the value of NH in the canonical model (1-2% below 3 keV) and the relative errors in DETABS component (Det0A used here) and model power law slope with energy in the NuSTAR band.
Detector Gain Tracking
The CALDB 20211020 release also updates the long-term tracking of the detectors using measurements of high-energy emission lines in the NuSTAR detector internal background and from annual observations of the Kepler supernova remnant. Details of the analysis can be found in the calibration memo (CAL_NuSTAR_20201020a).
This release of the gain files (v009) adds a trend slope correction for the period 2019 to 2021 due to a measured drop in background high-energy line energy centroid seen in all 8 NuSTAR detectors. No adjustment is made in this release to the line energy offset values as there is no evidence for significant change since 2019 at the 40 eV level (= one NuSTAR channel) in the low-energy scale from measurements of emission lines in the Kepler SNR spectrum.
Last update: 2021-10-27
References
- Grefenstette, B.W. et al. (2021) "NuSTAR gain tracking" NuSTAR calibration memo CAL_NUSTAR_20211020a (pdf)
- Madsen, K.K. et al. (2015) "Calibration of the NuSTAR High-energy Focusing X-ray telescope" ApJS 220, 8 (ADS)
- Madsen, K.K. et al. (2020) "NuSTAR low energy effective area correction due to thermal blanket tear" arXiv:2005.00569 (ADS)
- Madsen, K.K. et al. (2021) "Effective Area calibration of the Nuclear Spectroscopic Telescope ARray (NuSTAR)" JATIS, in prep. (arXiv 2110.11522)